
Visualizing Design Maturity with Competency Mapping
UX designers are expected to wear a lot of hats. Your average project will require a diverse skill-set be utilized. To be an effective designer, you’re going to need competency in a wide range of areas that include research, design, and writing. Ask a few designers what the key competencies needed are however and you’re likely to get different answers.
I wanted to answer the questions: What skills do UX designers need? What skills does the team currently have?
My goal was to accurately assess a designer’s unique combination of skills so we could find out where they currently are and where they are going. Success would include:
- A map of every designer on the team
- A big picture view of the competencies across the team
- Tracking how designers are growing in their competencies
- Templates mapped to competencies in core functions (design, research, etc.)
If I accomplished my goal, I’d certainly be able to answer my questions, but I would also have a system to help me facilitate conversations with designers about their professional development. They too could use it to have something to stand on to avoid the pitfalls of Dunning-Kruger and Impostor Syndrome. Also, as we scale the team, I’d have a good sense of what skills would be needed for new hires.
Challenge
Develop a system to visualize and track a designer’s skill as they progress in their career.
My Role
Research, Information design, Data Vis
Project
Time 1 month
Process
As I started work I put together a rough plan:
- Step 1: Create a list of core competencies
- Step 2: For each competency, define the activities that are used
- Step 3: Establish a proficiency leveling system
- Step 4: Map the competencies and levels visually
- Step 5: Assess each team member using the competency map
- Step 6: Integrate the maps into our everyday work
Creating Core Competencies
The first step in the process would be to map out the world of UX practice. While there are plenty of articles available online I could leverage, and even use my own knowledge on the subject I knew it wouldn’t be enough to rely solely on these resources. I’d have to take what is known about UX and apply it through the context of our UX practice in my workplace.
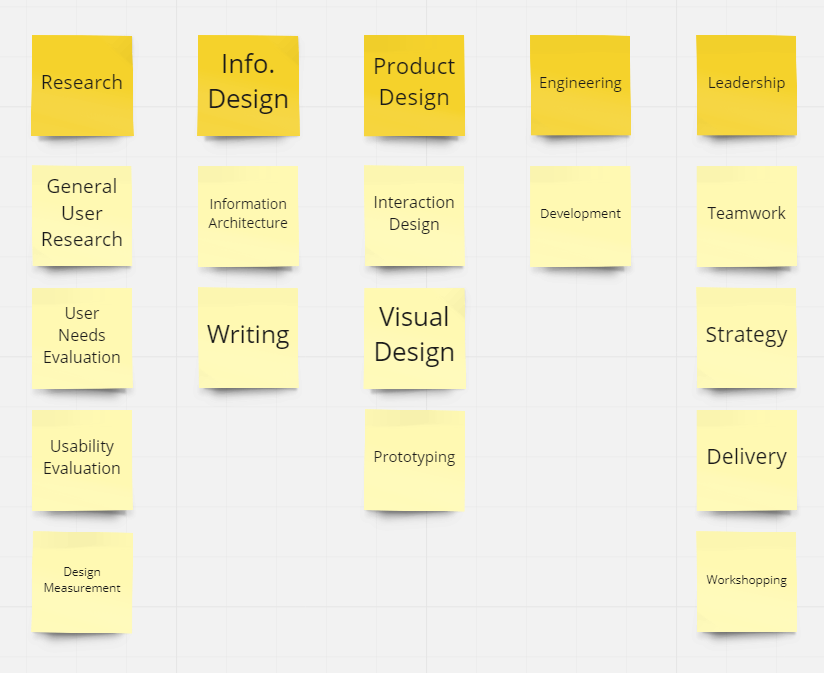
I landed on 14 separate competencies:
- General User Research
- User Needs Evaluation
- Usability Evaluation
- Design Measurement
- Information Architecture
- Prototyping
- Interaction Design
- Visual Design
- Writing
- Delivery
- Teamwork
- Strategy
- Development
- Workshopping
After I assembled these competencies I thought about how they could be organized. That led me to categorize them into groupings which would help me later translate the competencies into roles. Once this was done they looked like this:
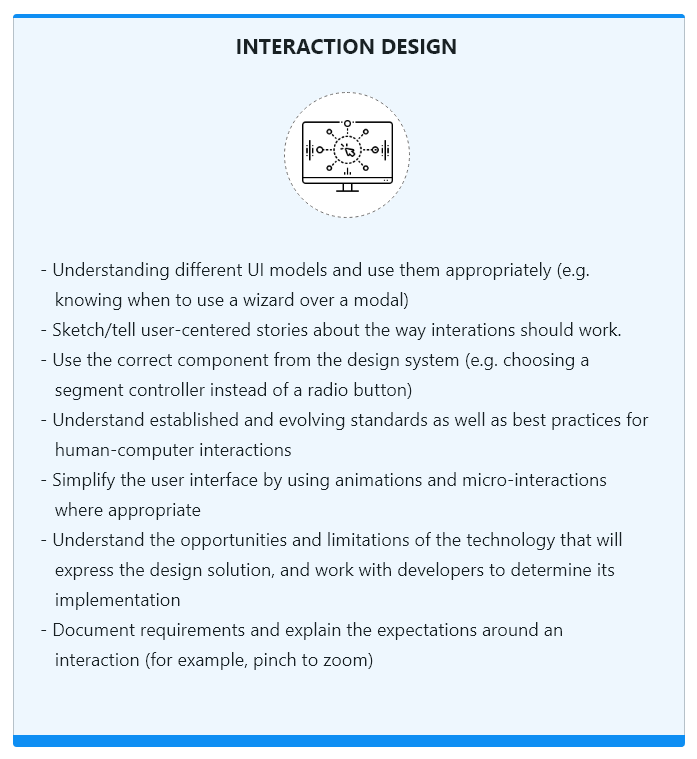
Defining Activities
Now that I had my list of competencies organized I began to identify the corresponding skills a designer would have that could then be measured. For each competency I would think about what they do and translated that to skills. A sample of a competency with its corresponding skills are shown below.
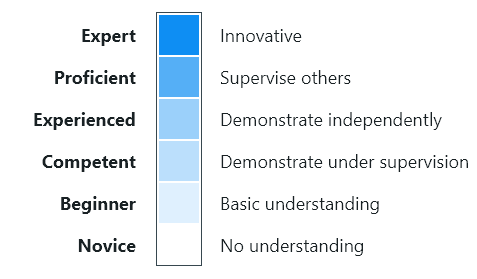
Proficiency Leveling System
With a set of skills assigned to each competency it was then time to shift my focus towards how we could measure proficiency. If the competencies represented the breadth of UX, proficiency would measure depth (see the traditional T-model). I didn’t want an overly-complicated system, but I wanted to account for the fact that a Senior Designer has likely not yet mastered a competency either. There’s more room to grow. I landed on a total of 6:
Mapping the competencies
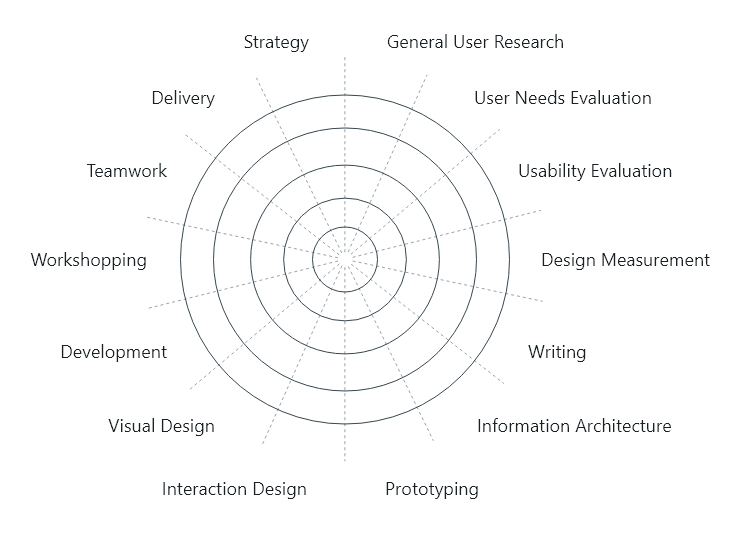
Once I had my competencies and levels, I began thinking about how to visualize the data. An early inspiration for me was initially derived from a big hobby of mine: watching football. Come draft time, college prospects are run through a vigorous combine where they are evaluated physically and by their performance. Visuals are created to quickly compare athletes against one another and the way they do this is with spider charts.
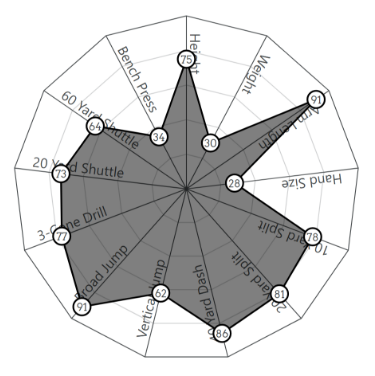
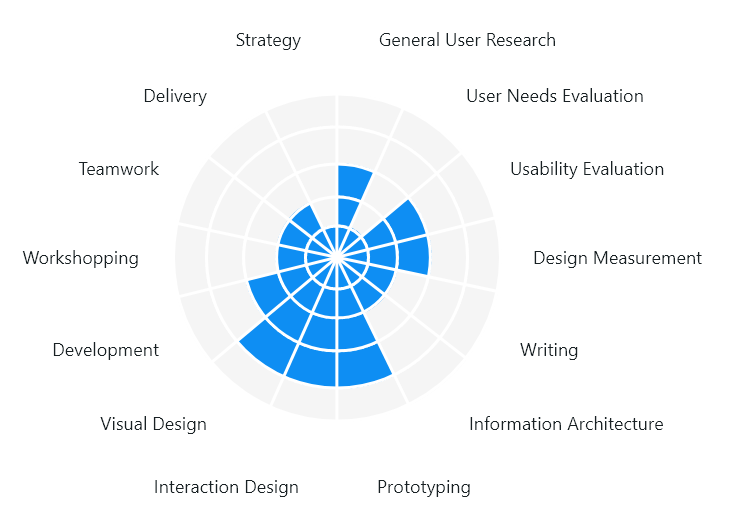
This seemed like a great way to also visualize the team’s competencies so that’s what I went with.
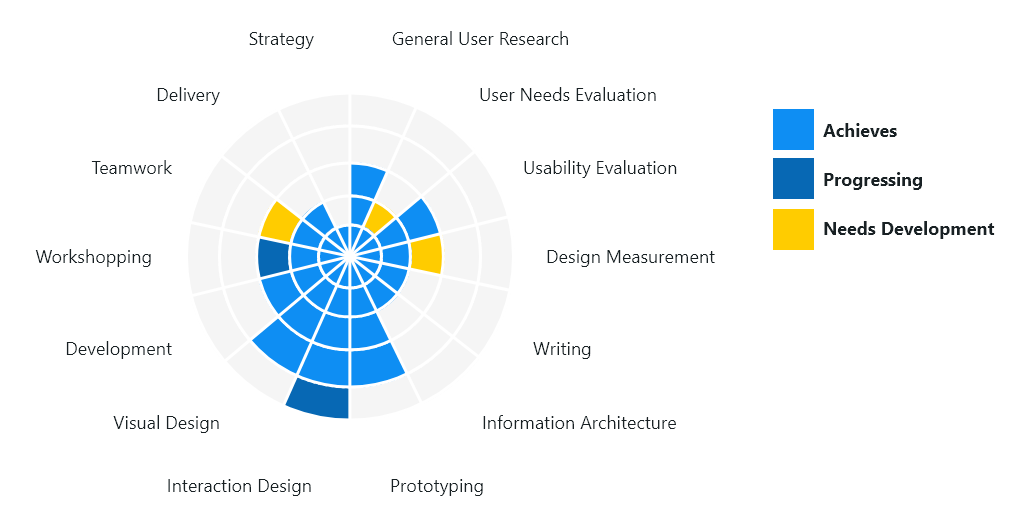
Finally, I needed to account for the variable states of progression. What was complete? What was in progress? This would give context to a designer’s trajectory. The three states I ended up with were:
- Achieved
- Progressing
- Development Needed
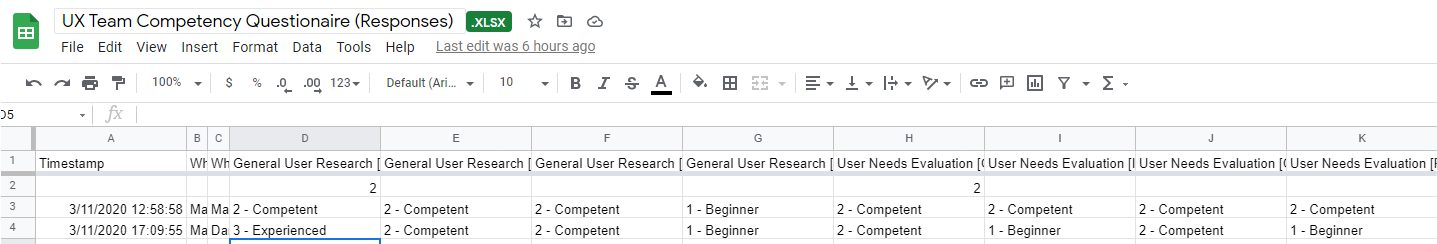
Assessing the team
Once I could visualize the data, I needed a way to assess each designer to get their individual results. What I did was put together a form that would send results to a spreadsheet. On the form were a series of questions for every skill in each competency where the designer could perform a self-assessment and rate their proficiency according to the leveling system. While this gave me a good baseline, it didn’t account for bias. What if a designer feels more confident than they really are? To account for that I also considered having that same designer be assessed by a peer who has worked with them for at least a year, as well as their manager. Then, taking all three assessments I could average the results and end up with something that felt more thorough.
Now that I had some real data to work with I could put everything together and below is the end result. The maps I produced would allow me to easily see competencies by individual and across the team.
Putting it to work
A year ago I had my team go through this exercise and it helped out in ways I didn’t expect. Initially my hope was that this would simply help me see where the team was, both individually and as a whole. But it also helped us to see the world of UX in the same way and translate that to our work. Additionally I think it gave the designers a real sense of perspective in relation to where they are in their careers. Moving forward I believe this system will continue to help our UX organization scale, and I am already thinking of ways to iterate.